Overview
There are times during a module when you may wish to see information about student usage of the teaching materials you have provided for them. After the time invested into building a good quality online course, it is useful to have some indicators that would demonstrate student engagement with the content, to make sure they are making the most of it.
In this article, we will show you how to access the logs and reports about the activities and resources within your DLE site.
How to use course reports as an indicator of student engagement?
To use the course reports as an indicator of student engagement, please follow the steps below:
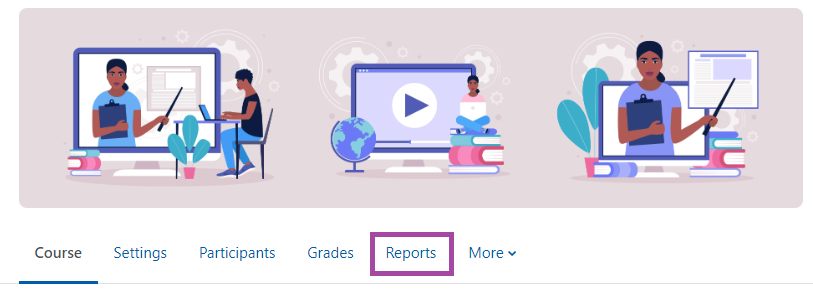
- Sign in to your Moodle account and select the course where you would like to access the reports. In the secondary menu click on ‘Reports’
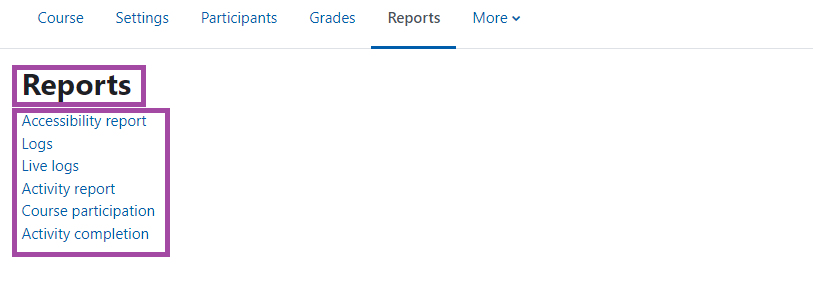
- The ‘Reports’ page of your DLE site will open. From here you will be able to access a range of data including; Accessibility report (Ally), Logs, Live Logs, Activity report, Course participation and Activity completion.
Are the students using the resources?
In the ‘Reports’ page, you can use the following two options in order to access the report about the materials you have created for your students:
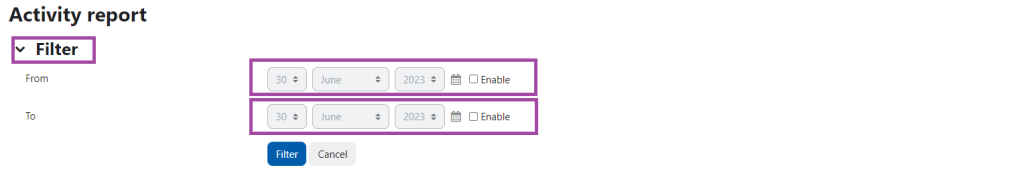
- ‘Activity report’ – This option allows you to look at views per activity across your Moodle site. Please note that it would not include the names of the students, but only the number of users and the number of views.
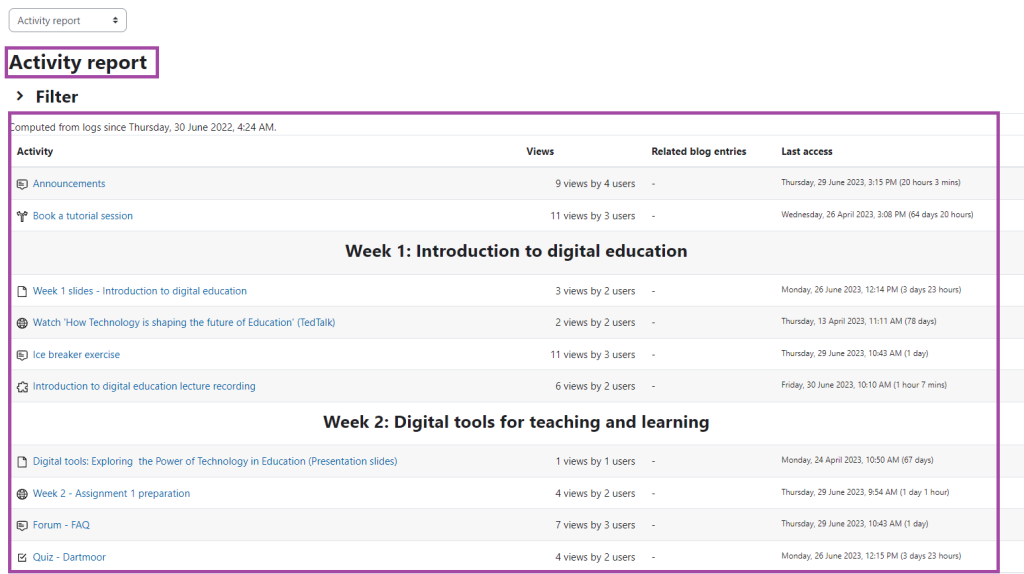
- You can also use the filter to select activity within a specific date range.
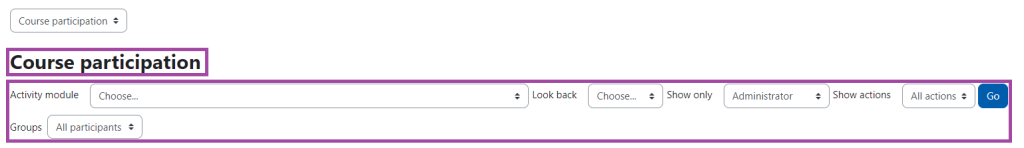
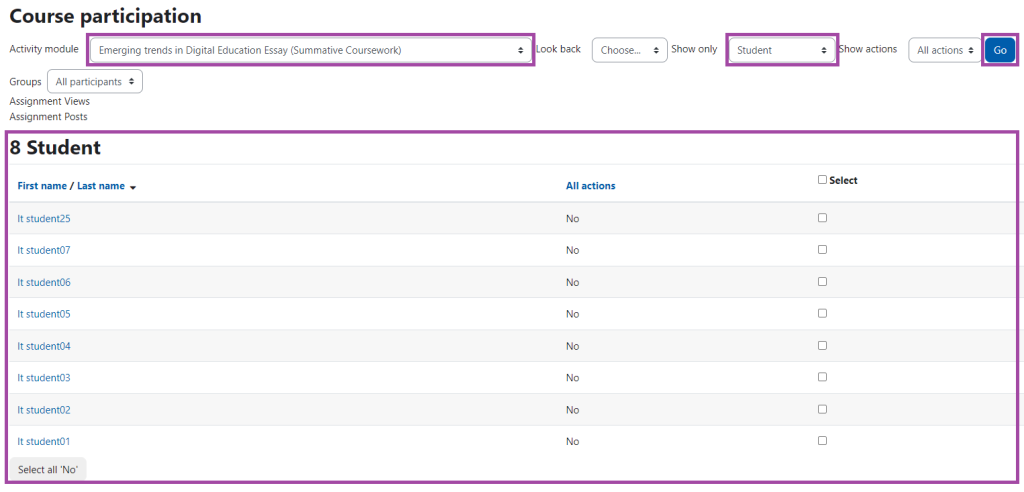
- ‘Course participation’ – with this option, you are able to select a specific activity from your Moodle site and pull a report which will show you individual named student engagement. Please note that you need to select a specific activity or resource in order to access the report. You could potentially use dates, user roles, or action types to filter the report.
Have the students completed activities?
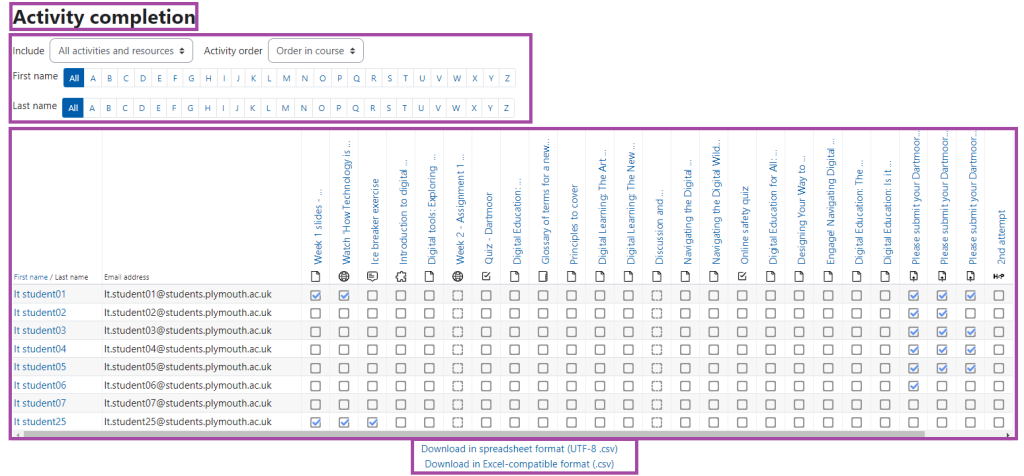
‘Activity completion’ with this option, you are able to track which resources or activities have been completed by your students. You can filter by activity and resource, the activity order and also use the alphabetic filter to filter the results.
Please also note that setting your activities and resources ‘to be marked complete when viewed’ is one of the most basic criteria for activity completion tracking.
Activity data can be exported as a *.csv file for offline viewing in Excel.
Are the students still active on the course?
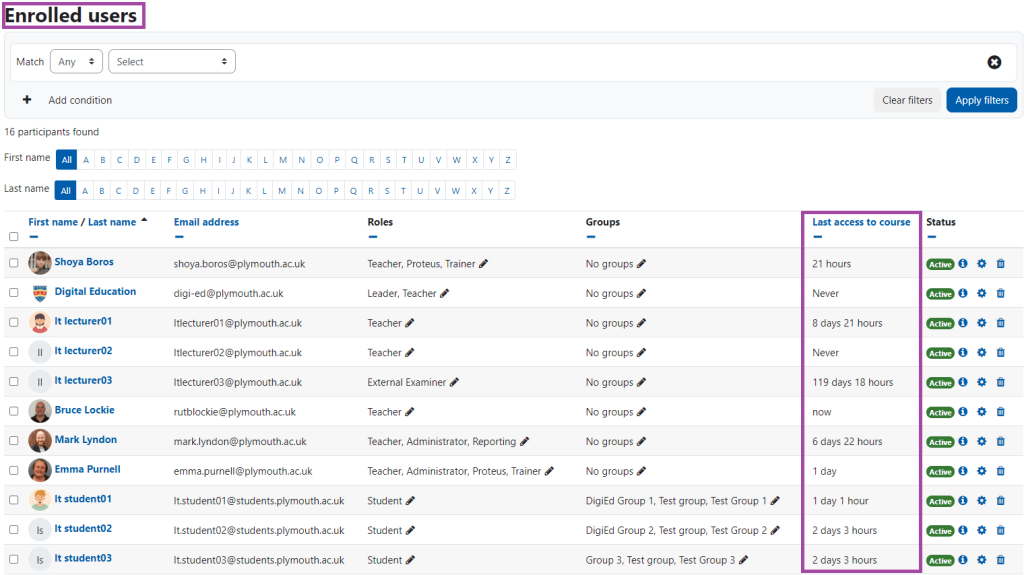
Under the ‘Participants’ menu in the secondary menu, there is another engagement indicator of your students, as you could view the time and date they last accessed your DLE site.
If you click on their name, you would be then taken to their profile for the course where there are also several other reporting options including; Outline & Complete reports.
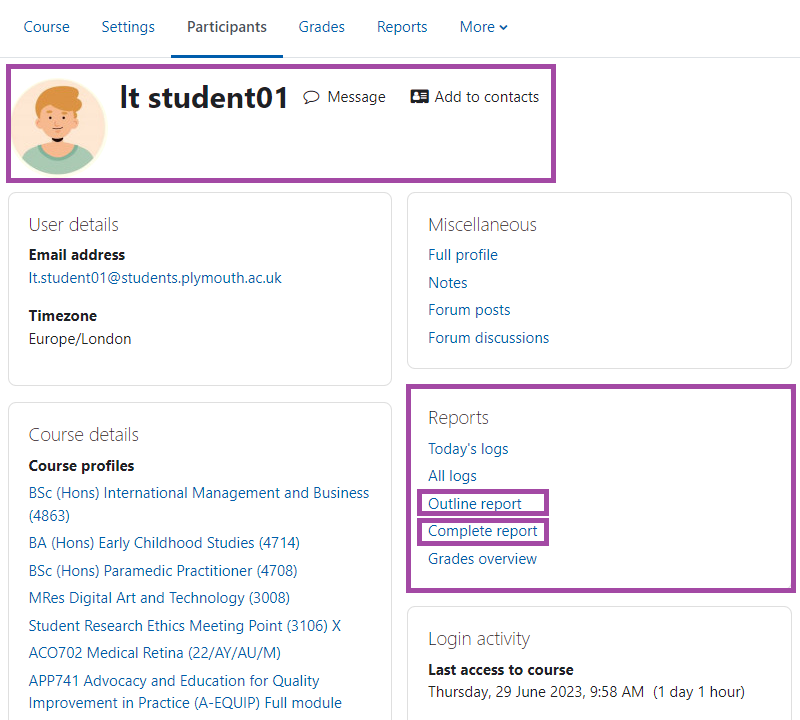
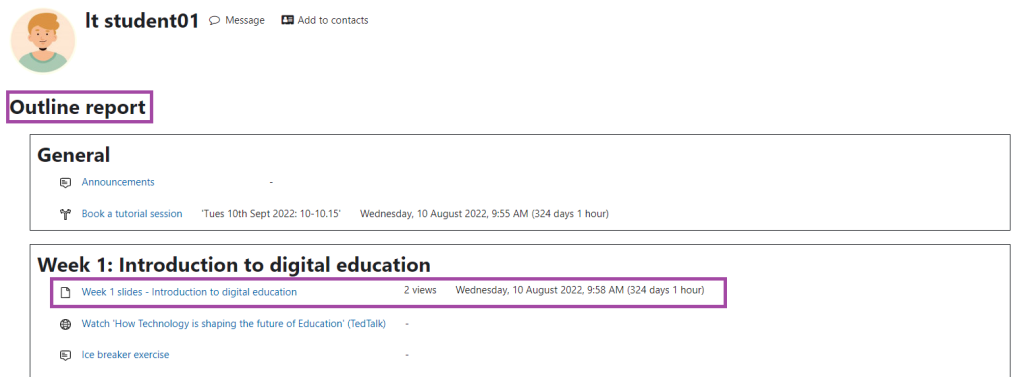
- ‘Outline report’ – with this option, you can access the date and time when your students last accessed each resource or activity within your DLE site. You are also be able to see the number of times they accessed a resource or activity.
- ‘Complete report’ – with this option, you can gain more information about how your students interacted with your resources and activities, such as viewing, answering, posting, and many more.
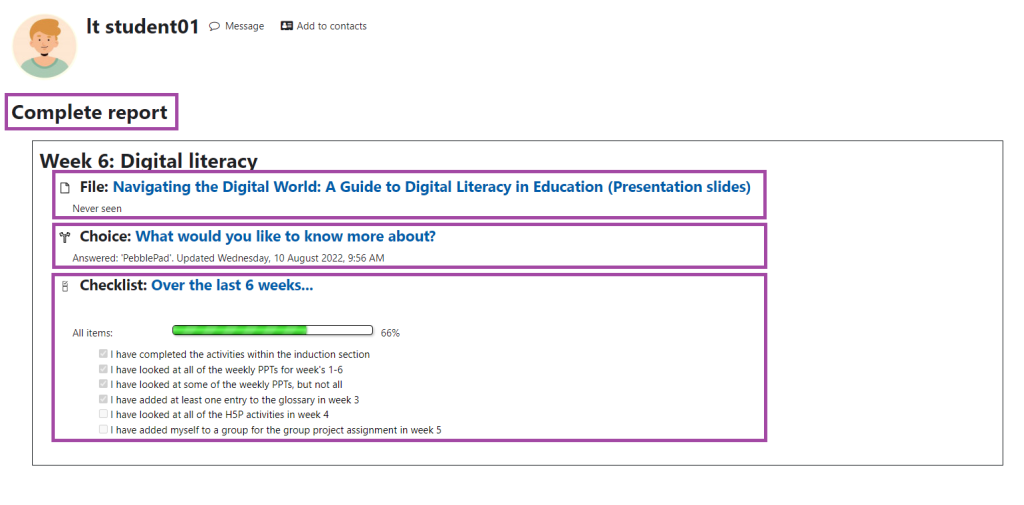
Both of these reports can give (limited) insight into the level of student interaction with your course content.
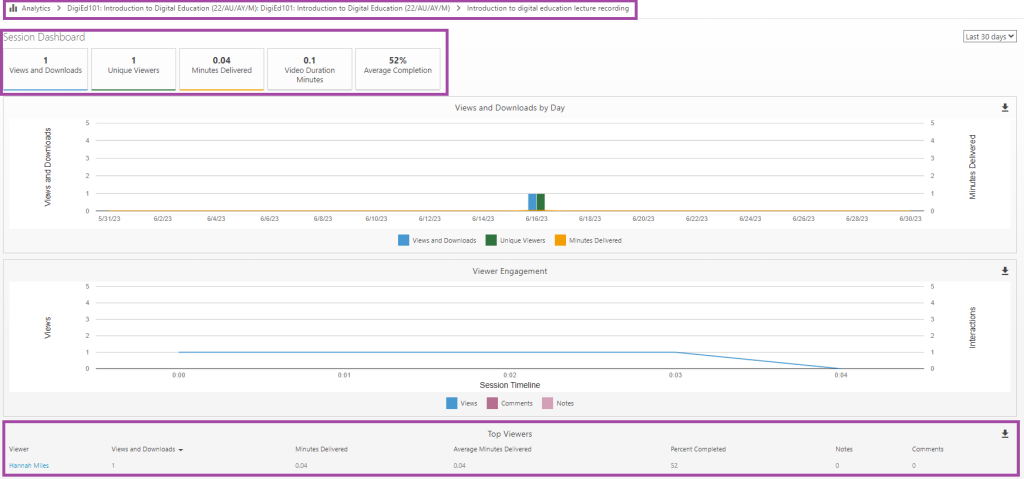
Did the students view the Panopto recordings?
If you have used Panopto within your DLE site, then you will be able to access some statistics about the usage of your videos for which you would navigate to the folder first where the recordings are originally stored. Once you are in that Panopto folder, you would then need to hover your mouse over a video after which you would need to click on the ‘Stats’ button.
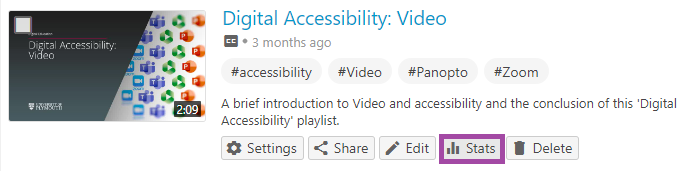
You would be directed to a new page where possibly the most useful element is the ‘Top Viewers’ table, which can be extended to show all viewers of the video, with statistics relating to the degree of engagement with the video. This list shows you who has viewed your video and by inference those who have not.