Overview
Moodle quizzes can be used for formative and summative in-class tests to evaluate student understanding of course material within a semester. The attempts made by students under a ‘Quiz’ activity like this are usually automatically graded, however, they can be also manually updated if needed. Additionally, you can also either apply overall feedback (which would be feedback based on an entire student attempt) or specific feedback (which would be based on each question response). Once you are happy with the grades, you can then release them to your students.
In terms of feedback and further statistics, you might want to track your student attempts in more detail to see which question was the easiest or the most complex one to discuss further with students in a feedback session. As such, you might want to access the average and median grade, standard deviation, error ratio, standard error, and many more.
In this article, we will show where you can access the statistics related to a ‘Quiz’ activity in Moodle.
Statistics menu in a Moodle Quiz
To access statistics related to a ‘Quiz’ activity in Moodle, please follow the steps below:
- Please navigate to the dashboard of a ‘Quiz’ activity which you can do if you click on its title on the main DLE page.
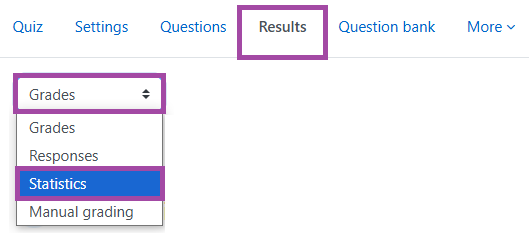
- Once you are there, please click on the ‘Results’ menu and then select the ‘Statistics’ option from the ‘Grades’ drop-down list.
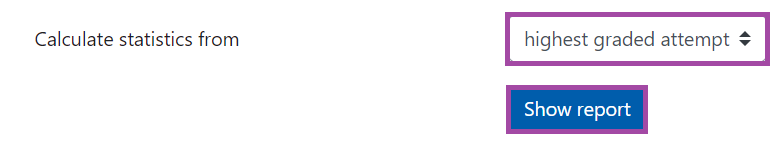
- Here, you might want to configure your calculation based on the number of attempts in the ‘Statistics calculation settings’ section which can be all attempts, the highest, the first, or the last attempt. Once you selected an option from the drop-down list, please click on the ‘Show report’ button.
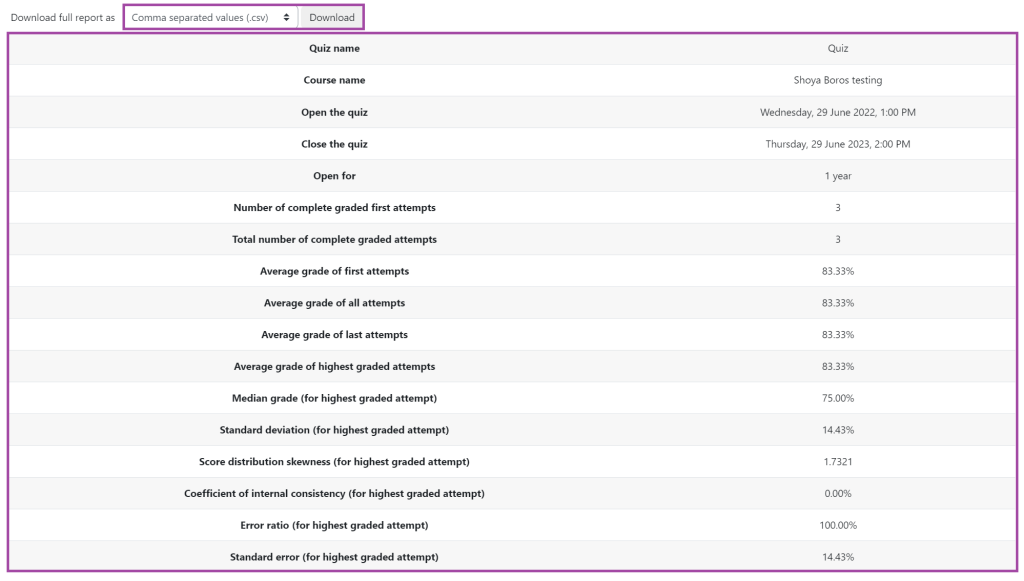
- In the first section named ‘Quiz information’, you will see more generic statistics and information related to the ‘Quiz’ activity, such as the name of the activity; start and end date; time limit; the number of attempts, average grade of the first, last and all attempts; median grade; standard deviation; and many more. You will also be able to download this table to your machine.
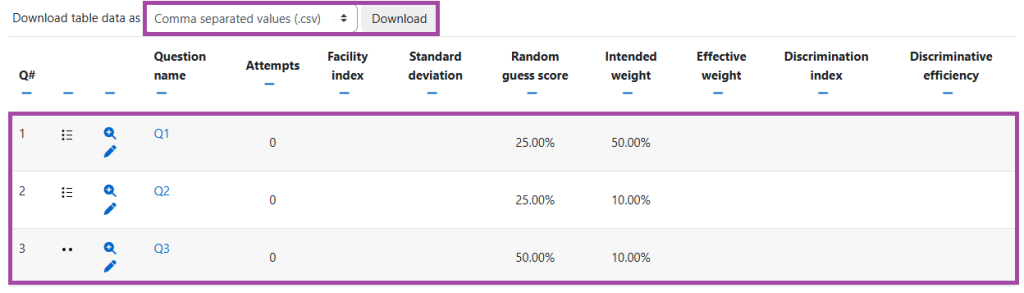
- In the second section named ‘Quiz structure analysis’, you will be able to access more detailed analytics in relation to each question, such as the number of attempts, facility index, standard deviation, random guess score, intended weight, and many more. You will also be able to download this table to your machine.
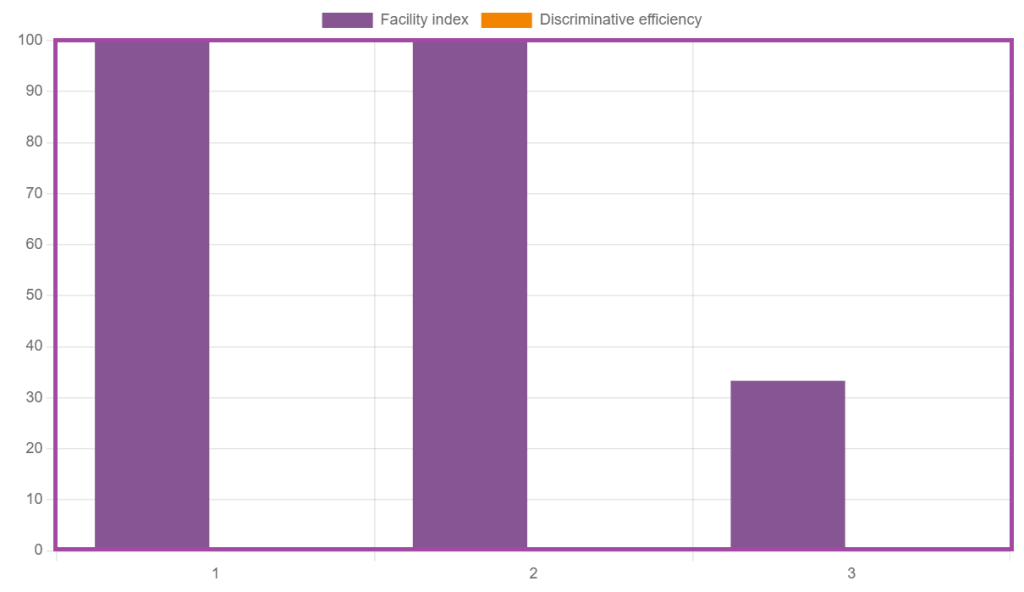
- In the third section named ‘Statistics for question positions’, you will be able to access a chart in relation to facility index and discriminative efficiency.