Overview
There is an online ‘Module Box’ block on the right-hand side of every Moodle course. The purpose of this block is to provide an easy and familiar way to deliver all module materials to you as an External Examiner, from one location within the DLE (Moodle).
This can also include sharing student attempts of a ‘Quiz’ activity in Moodle, to help them get a better understanding of the summative assessments, such as in-class tests or formal exams.
In this article, we will show you how to access student attempts of a ‘Quiz’ activity in Moodle.
How to access student attempts of a Moodle Quiz
Once you navigated to the Module Box, you might see URL links that would direct you to student attempts uploaded to a Moodle Quiz. As such, you will need to get familiar with four different pages, depending on whether the achieved grades, student responses, statistics or the manual grading process has been shared with you.
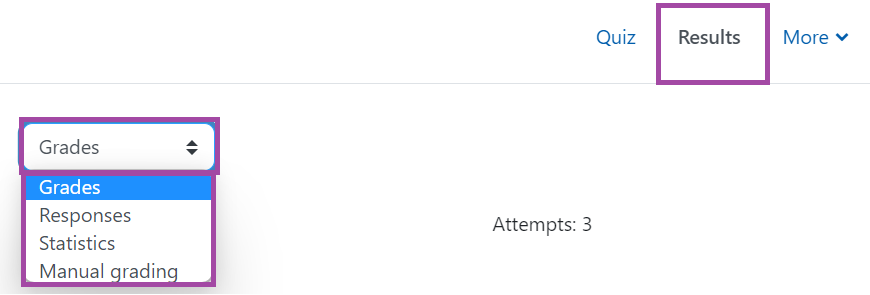
Grades page
The ‘Grades’ page of a Quiz contains all student attempts and shows the points achieved under each individual question, including the final and average grades in Moodle.
This page includes:
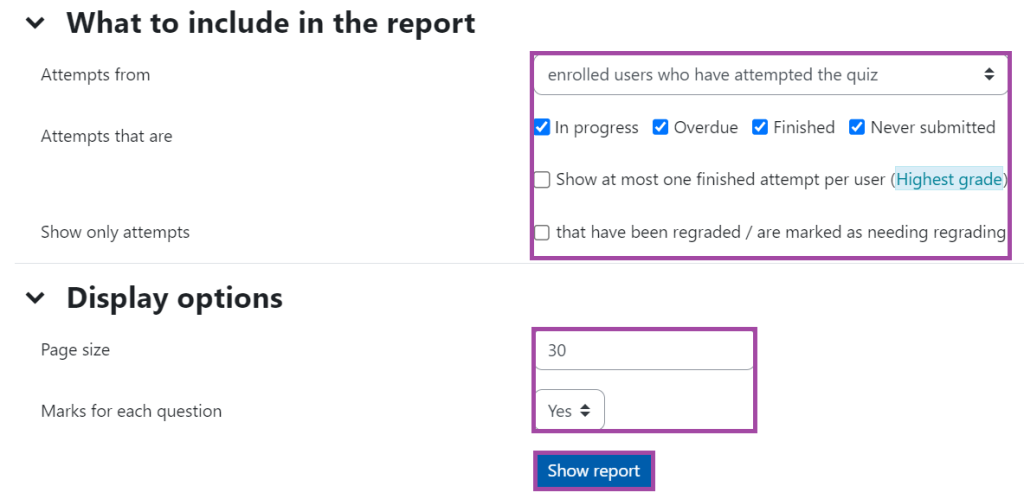
- Filters that can be used to filter out attempts based on who has or has not attempted the activity; showing the highest grade (if multiple attempts were allowed); needs to be or were re-graded; marks for each question and page size to customise the number of attempts shown on a single page. Please note, if you use any of these filters, you will need to click on the ‘Show report’ button to refresh the displayed data.
- A table of student attempts and grades based on each individual question that can be opened by clicking on their titles (in this case ‘Q1’, ‘Q2’, ‘Q3’, etc); including whether the student has started an attempt, is in progress or finished; and the start and end date of the attempt. You can also filter them based on the initials of first and surnames. The table can then be downloaded as an Excel spreadsheet if needed.

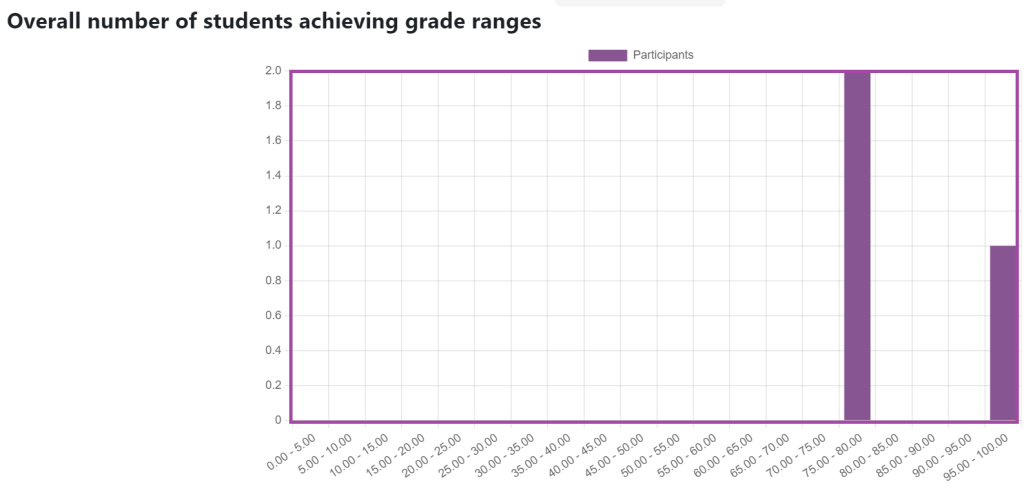
- Graph about the achieved grade ranges based on student attempts.
Responses page
The ‘Responses’ page of a Quiz contains all student attempts and shows the final grades, as well as the responses given under each individual question. You can also see whether these responses were correct or incorrect.
This page includes:
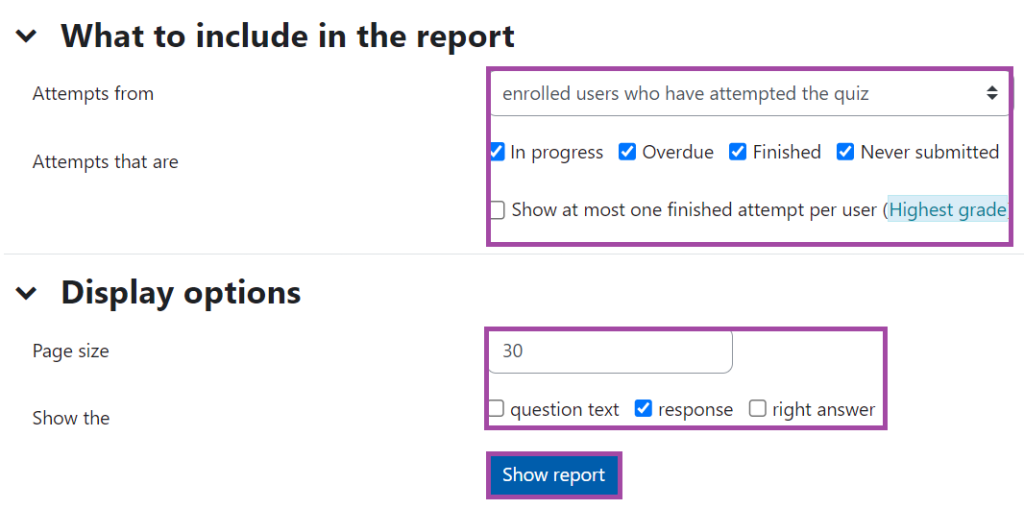
- The same filters as you can find under the ‘Grade’ page. You can also choose to see the responses only or perhaps the question texts and the correct answers as well.
- A table of student attempts and final grades based on each individual question; including whether student responses were correct or incorrect. You can also filter them by using the initials of first and surnames. The table can be downloaded as an Excel spreadsheet if needed.

Statistics page
The ‘Statistics’ page of a Quiz contains data analytics of all student attempts to see, for example, which question was the easiest or the most complex one. This makes it possible to see the average and median grade, standard deviation, error ratio, standard error, and many more.
This page includes:
- information regarding the activity,
- structure analysis, and
- statistics from question positions.
For more information about what exactly is included here, please visit the following supporting material.
Manual grading page
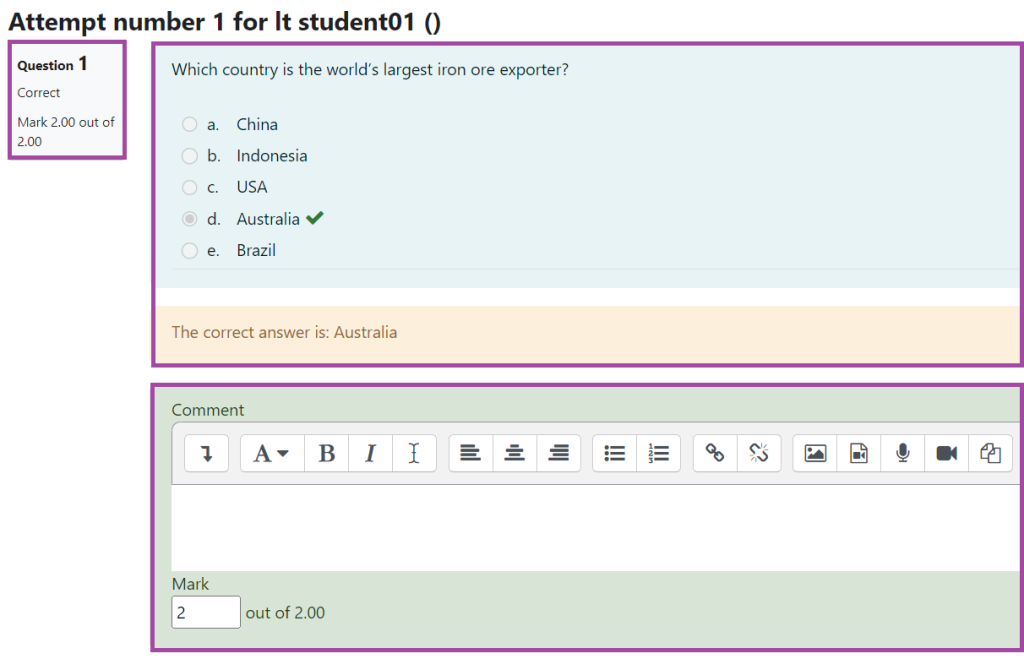
The ‘Manual grading’ page of a Quiz contains the student attempts that had to be manually graded. It is a common method to use in case students have to input text (such as ‘Essay’, ‘Short Answer’ or ‘Fill in the blanks’ question types), or if accidentally an error has been made to a question, therefore requiring maximum points be allocated for it. It is then possible to see the list of these questions and the grades that have been (or need to be) manually updated.

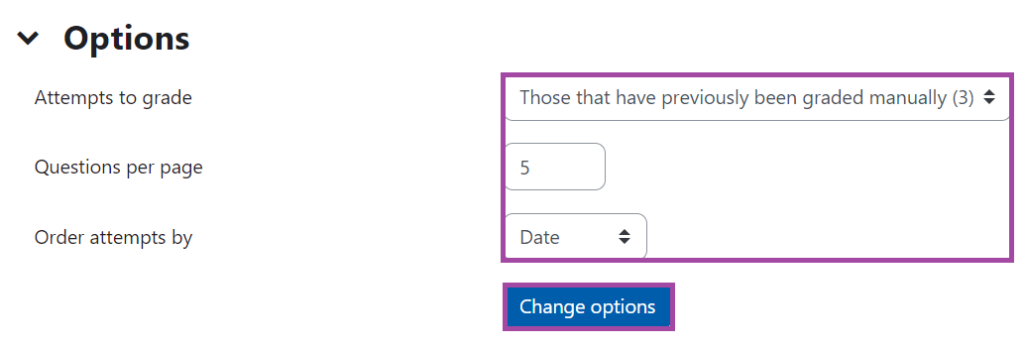
- If you click on the ‘[number] updated grades’ button, you will be able to view which exact question had to be graded manually, and under which student attempts. You can also use filters, for example, to change the order of the elements on the list. Please note, if you use any of these filters, you will need to click on the ‘Change options’ button to refresh the displayed data.
