The Accessibility+ Report is a detailed report that evaluates the accessibility compliance of your Moodle course content. It breaks down the accessibility checks into specific items and shows the compliance rates for each one.
Accessing the Brickfield Accessibility Report
If the course within the DLE has already been submitted for analysis, you will be able to access the reports in one of two ways.
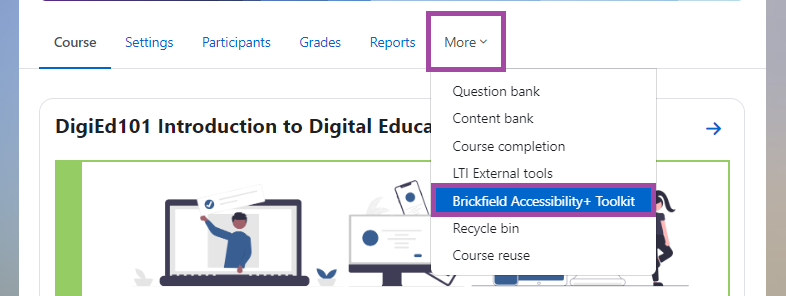
Firstly, the accessibility report can be accessed from ‘More’ in the secondary menu, then selecting ‘Brickfield Accessibility+ Toolkit.
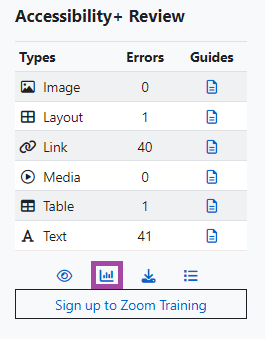
Alternatively, if you have installed the ‘Accessibility+ Review block’ in the right hand block menu, then you can access the report by clicking on the ‘View Accessibility+ Report’ icon.
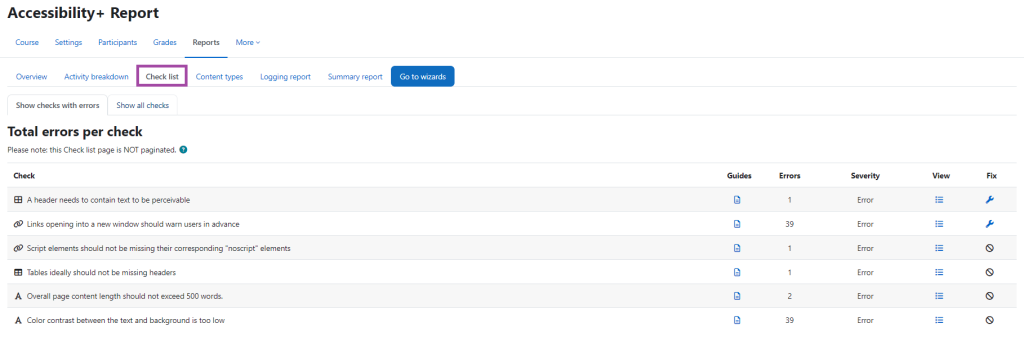
This will take you to the ‘Accessibility+ Report’ and the ‘Check list’ tab selected as the default.
Understanding the Accessibility+ Report
Checklist Report
The default page that the Accessibility+ Report opens is the ‘Check list’ tab. The Check list report provides a list of the checks that have failed and all checks for the course.
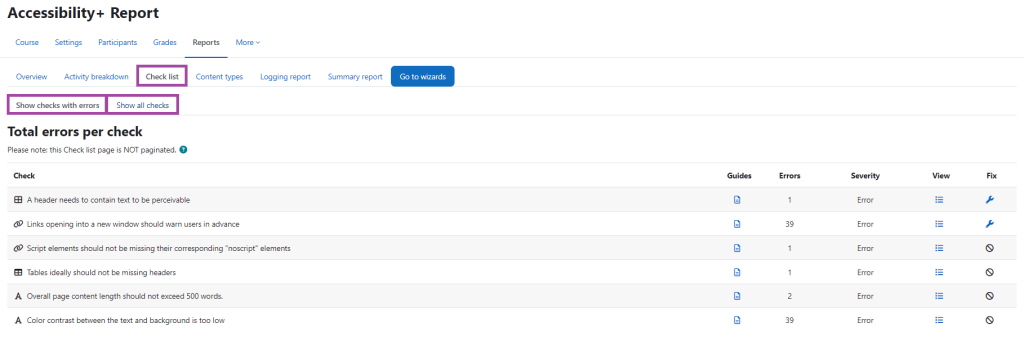
The ‘Check list’ has two different tabs, ‘Show checks with errors’ to view the checks with errors and ‘Show all checks” to view all checks, regardless of whether errors exist for them or not.
The ‘Check list’ view provides the following details:
Check: The part of the course that Brickfield has checked.
- Guides: A help guide with further information on the check, include a summary and the impact.
- Errors: Total errors that have occurred.
- Severity: The severity level.
- View: Provides a link to the ‘Error page’ for all the errors which relate to this check.
- Fix: Where relevant, some checks have corresponding Fix wizards, which allow for bulk solutions (more information will be available in the Knowledge Base – Brickfield Accessibility+ Toolkit Wizards).
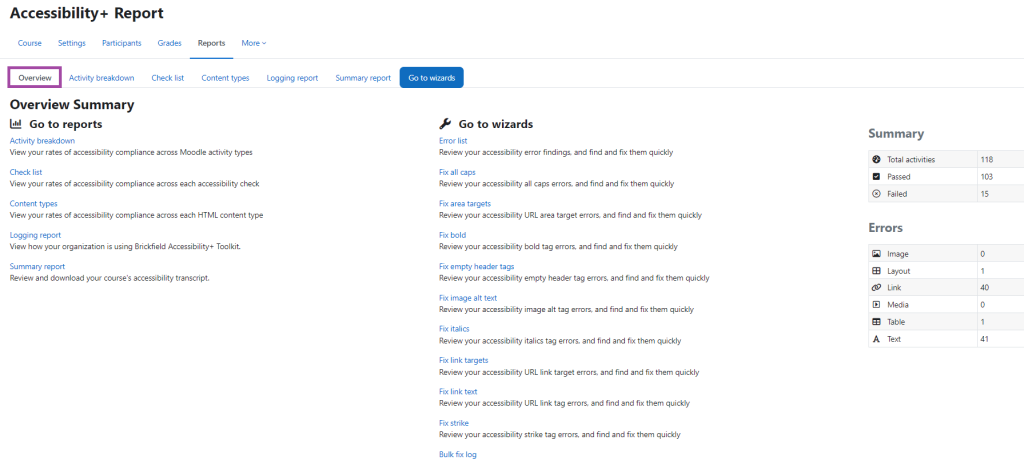
Overview Report
The Overview report provides the ability to access any enabled report and wizard within the toolkit. This report provides summary information on the activities and HTML content types of the course.
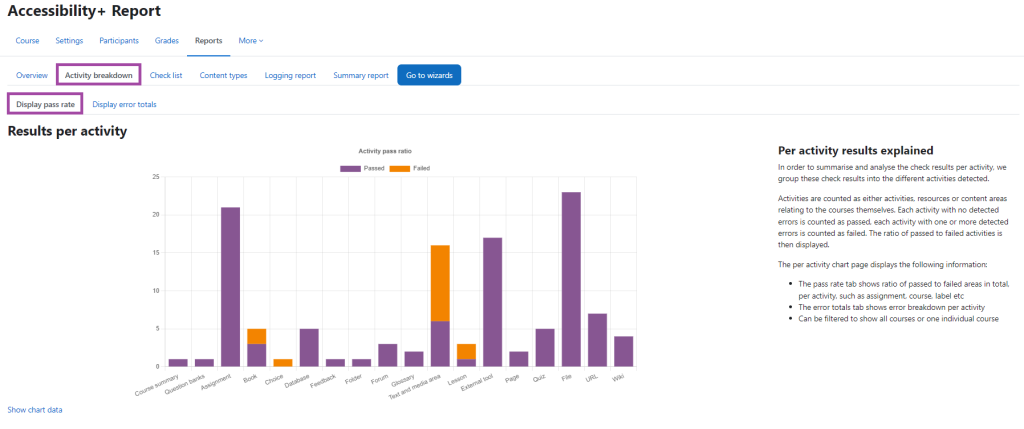
Activity Breakdown Report
The Activity breakdown report provides a breakdown of the pass rate and error totals per activity type for the course, with two different tabs. ‘Display pass rate’ to display the pass/fail per activity type and ‘Display error totals’ to display the total error count per activity type.
In the ‘Display pass rate’ view the toolkit summarises the results per activity. Each activity with no detected errors is counted as passed, each activity with one or more detected errors is counted as failed. The ratio of passed to failed activities is then displayed.
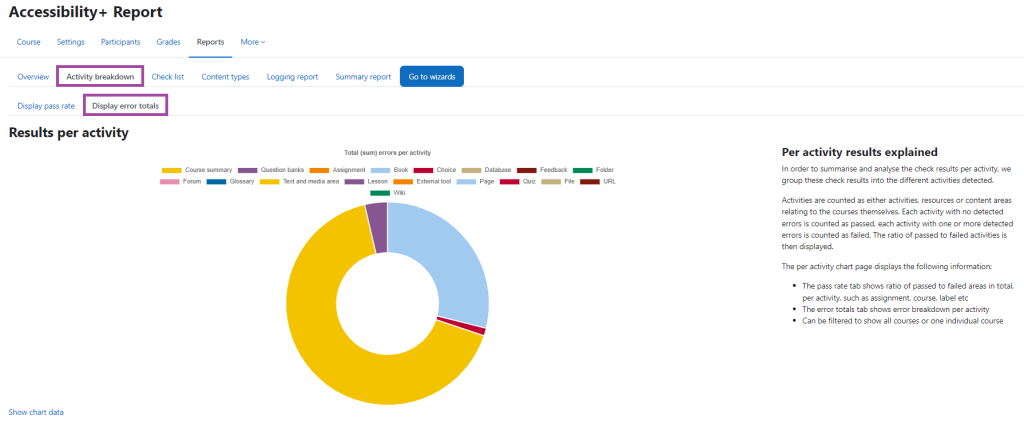
‘Display error totals’ to display the total error count per activity type, displaying the total (sum of all errors by activity in a donut graph).
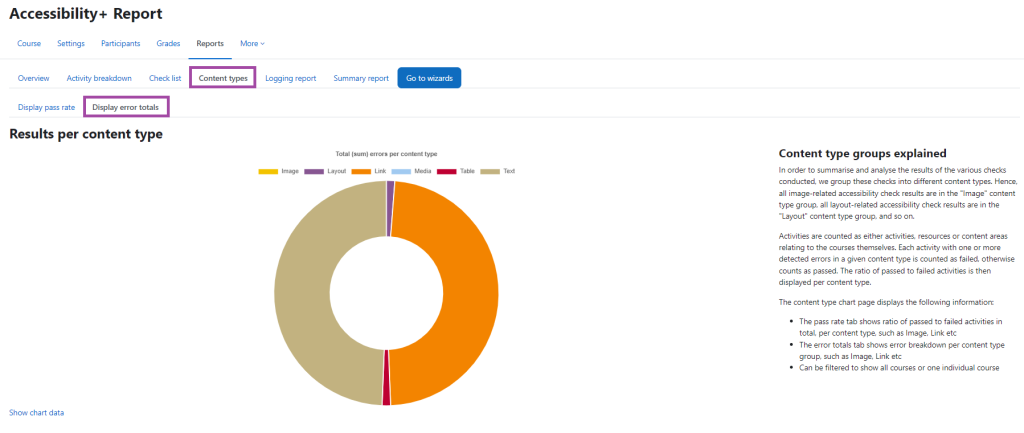
Content types report
The ‘Content types’ report provides a breakdown of the pass rate and error totals per HTML Content type for the course with two different tabs. “Display pass rate” to display the pass/fail per HTML content type and “Display error totals” to display the total error count per HTML content type, which are as follows:
- Image
- Layout
- Link
- Media
- Table
- Text
The ‘Display pass rate’ tab shows ratio of passed to failed activities in total, per content type, such as Image, Link etc.
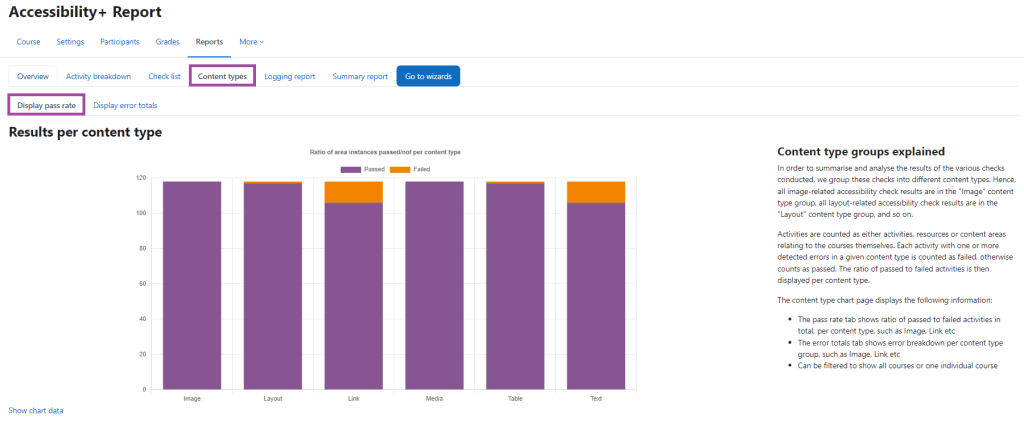
The ‘Display error totals’ tab shows error breakdown per content type group, such as Image, Link etc.
Summary Report
The Summary report provides a breakdown of the accessibility errors found within a individual course and is a combination of many of the Find tools found within the toolkit. You can download a PDF transcript of the course with a link called Download PDF located in the top right of the report.
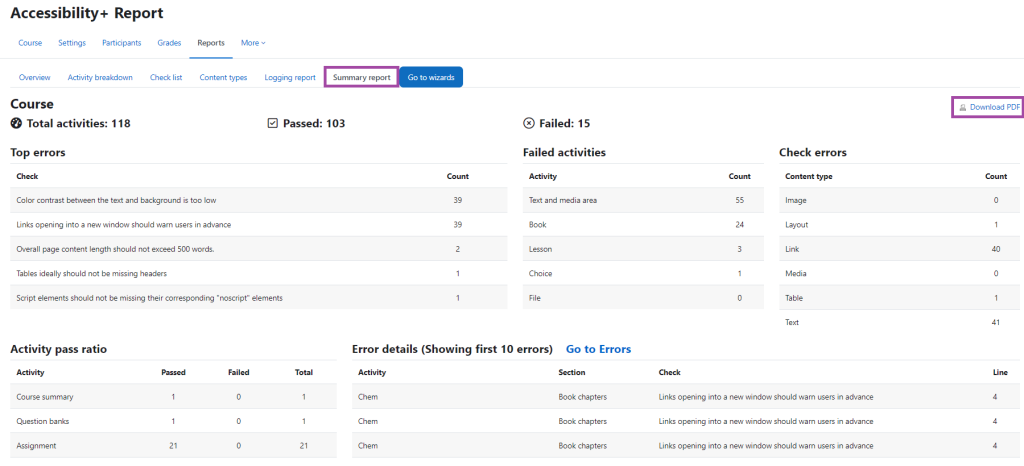
The Summary report shows the following details:
- Top errors: the most failed HTML checks and their total error count.
- Failed activities: the top failed activity types and their total error count.
- Check errors: the total error count for each HTML content type.
- Activity pass ratio: course activities and the total number that have passed or failed.
- Error Details (Showing first 10 errors) –
- Activity: the activity name.
- Section: the course section the activity exists within.
- Check: HTML check that failed.
- Line: the line of code the error exists on.